In this graph, contractionary policy causes ______.
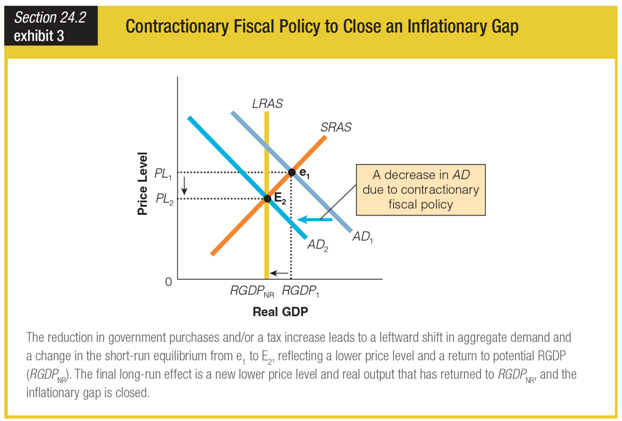
a. equilibrium to shift down along the aggregate demand curve
b. equilibrium to shift up along the aggregate demand curve
c. the aggregate demand curve to shift to the right
d. the aggregate demand curve to shift to the left
d. the aggregate demand curve to shift to the left
You might also like to view...
The above figure shows the Lorenz curves for four different countries. Which of the following statements CAN be made on the basis of the graph?
A) Country C has the best balance between equity and efficiency. B) Country A is a socialist country. C) The income distribution is more equal in country B than in country D. D) all of the above
Which of the following groups are overrepresented among those with low incomes?
a. youthful inexperienced workers b. college students working on graduate degrees c. single-parent families d. all of the above
What percentage of the average U.S. firm's costs are accounted for by wages and salaries?
A. 40. B. 60. C. 75. D. 85.
Refer to the information provided in Figure 27.3 below to answer the question(s) that follow.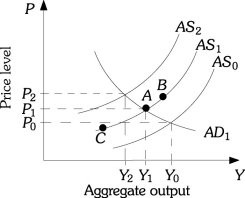 Figure 27.3Refer to Figure 27.3. Assume the economy is at Point A. Lower oil prices shift the aggregate supply curve to AS0. If the government decides to counter the effects of lower oil prices by decreasing net taxes, then the price level will be ________ than P0 and output will be ________ than Y0.
A. greater; greater B. less; less C. less; greater D. greater; less