Use a graphing calculator to plot the data and find the quadratic function of best fit.An engineer collects data showing the speed s of a given car model and its average miles per gallon M. Use a graphing calculator to plot the scatter diagram. What is the quadratic function of best fit? Round values to the nearest thousandth.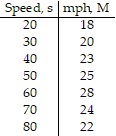
A. M(s) = -0.631x2 + 0.720x + 5.142
B. M(s) = -6.309x2 + 0.720x + 5.142
C. M(s) = -0.006x2 + 0.720x + 5.142
D. M(s) = 0.063x2 + 0.720x + 5.142
Answer: C
You might also like to view...
Use Euler's method to find y-values of the solution for the given values of x and ?x, if the curve of the solution passes through the given point.  = y2(1 - 2x); x = -1 to x = 0.5; ?x = 0.5; (-1, -1)
A. 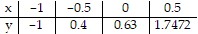
B. 
C. 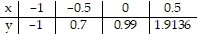
D. 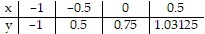
Graph the equation by determining the missing values needed to plot the ordered pairs.x + 2y = 4; (0, ), ( , 0), (1, ), ( , 1)
A. 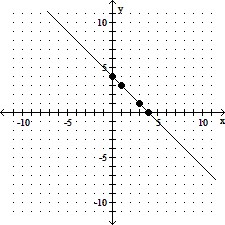
B. 
C. 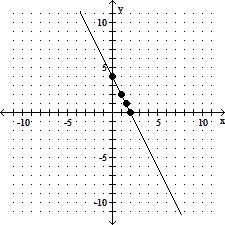
D. 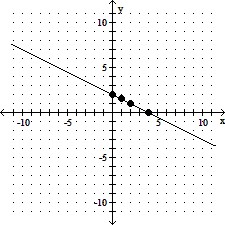
Solve the problem.A coffee store has available 75 pounds of A grade coffee and 120 pounds of B grade coffee. These will be blended into 1 pound packages as follow: an economy blend that contains 4 ounces of A grade coffee and 12 ounces of B grade coffee and a superior blend that contains 8 ounces of A grade coffee and 8 ounces of B grade coffee. Using x to denote the number of packages of the economy blend and y to denote the number of packages of the superior blend, write a system of linear inequalities that describes the possible number of packages of each blend. Graph the system and label the corner points.
What will be an ideal response?
Write an algebraic expression, using x as the variable.1.7 less than some number
A. 1.7 - x B. 1.7x C. x - 1.7 D. x + 1.7