Exhibit 4-8 Demand and supply curves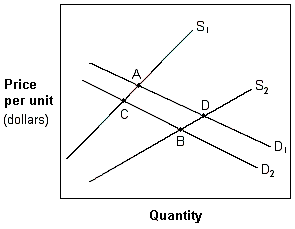
In Exhibit 4-8, a movement from A to B is best explained by:
A. an increase in income and in the number of suppliers.
B. an increase in the price of other goods.
C. an increase in the population.
D. a decrease in income if X is a normal good and an improvement in the technology used to produce the good.
Answer: D
You might also like to view...
Which of the following is the best definition of economic growth?
A) the opportunity cost of capital B) the sustained expansion of production possibilities C) the investment in capital and consumption goods by an economy D) increased development of land and entrepreneurship E) the opportunity cost of consumption
Suppose there are currently 100 people unemployed, 1500 people employed, and 2000 people in the working age population. The labor force participation rate equals 100 times
A) 100/1500. B) 100/1600. C) 1500/2000. D) 1600/2000.
Does the fact that diamonds, which we do not need to survive, are more expensive than water, which is a necessity, constitute a violation of utility maximization?
What will be an ideal response?
If the money supply is $250 billion and nominal GDP is $1 trillion, the velocity of money is:
a. 0.25. b. 0.40. c. 2.50. d. 4.00.