Solve the problem.The following table shows the median number of hours of leisure time per week for Americans in various years.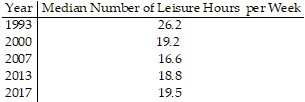 Let f(t) be the median number of hours of leisure time at t years since 1993. Use a graphing calculator to plot a scatterplot to describe the data. Using the same viewing window, draw the graph of the quadratic model
 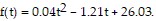 Use the model to estimate when the median number of hours of leisure time was the lowest.
What will be an ideal response?
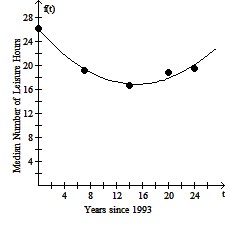
The median number of hours of leisure time was the lowest in 2008.
Mathematics
You might also like to view...
Solve the problem.Suppose c(x) = x3 - 22x2 + 20,000x is the cost of manufacturing x items. Find a production level that will minimize the average cost of making x items.
A. 11 items B. 13 items C. 12 items D. 10 items
Mathematics
Provide an appropriate response.Give the y-intercept of the equation: 4x = y + 8
A. (0, 2) B. (0, 8) C. (0, -8) D. (2, 0)
Mathematics
Subtract.(8y + 2) - (-6y + 3)
A. 14y + 5 B. -14y + 1 C. 14y - 1 D. 13y
Mathematics
Factor by grouping.x3 + 5x2 + 8x + 40
A. (x - 5)(x3 + 8) B. (x + 5)(x2 - 8) C. (x + 5)(x2 + 8) D. (x + 5x)(x2 + 8)
Mathematics