Use a graphing calculator to plot the data and find the quadratic function of best fit.The number of housing starts in one beachside community remained fairly level until 1992 and then began to increase. The following data shows the number of housing starts since 1992 (x = 1). Use a graphing calculator to plot a scatter diagram. What is the quadratic function of best fit?
A. H(x) = 3.268x2 + 30.494x + 168.982
B. H(x) = -3.268x2 + 30.494x - 168.982
C. H(x) = -3.268x2 + 30.494x + 168.982
D. H(x) = -3.268x2 - 30.494x + 168.982
Answer: C
You might also like to view...
Find the requested asymptote(s) of the given function. f(x) = 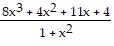 ; Find the slant asymptote.
A. y = 8x B. y = 8x + 11 C. y = 8x + 4 D. y = 1 + x2
Solve the problem.Find an equation of the hyperbola that passes through the points (-3, -2) and (4,  ).
).
A.  -
-  = 1
= 1
B.  -
-  = 1
= 1
C. 3y2 - 7x2 = 1
D.  -
-  = 1
= 1
A die is rolled five times and the number of fours that come up is tallied. Find the probability of getting the given result.Exactly two fours
A. .216 B. .161 C. .116 D. .002
Use the two-stage method to solve.Maximizez = 12x1 + 15x2subject to:x1 + x2 = 10 3x1 + 3x2 ? 36 4x1 + 2x2 ? 18 x1 ? 0, x2 ? 0
A. Maximum is 147 for x1 = 1, x2 = 9 B. Maximum is 144 for x1 = 2, x2 = 8 C. Maximum is 120 for x1 = 10, x2 = 0 D. Maximum is 150 for x1 = 0, x2 = 10