Which of the following describes an individual’s labor supply curve when the desire for more free time is stronger than the desire for more wage-related income?
a. U-shaped
b. backward bending
c. upward sloping
d. downward sloping
b. backward bending
You might also like to view...
Refer to the information provided in Figure 5.7 below to answer the question(s) that follow.
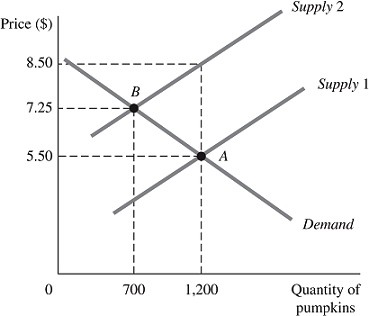 Figure 5.7The above figure represents the market for pumpkins both before and after the imposition of an excise tax, which is represented by the shift of the supply curve.Refer to Figure 5.7. Using the midpoint formula, the price elasticity of demand for pumpkins from the equilibrium point before the imposition of the tax to the equilibrium point after the imposition of the tax is
A. -0.02. B. -0.47. C. -2.11 D. -4.43
Evaluate the following statement. "If marginal product is falling it will bring down the average product."
What will be an ideal response?
Use the above table. If the marginal revenue product is $20, how many workers will the profit maximizing monopsonist hire?
A) 1 B) 2 C) 3 D) 4
The additional output produced by adding one more unit of an input is the:
A. marginal product. B. average product. C. total production. D. slope of the marginal product curve.