In 2011, the average income for households in the United States was about:
A. $69,821.
B. $42,820.
C. $56,610.
D. $64,842.
Answer: A
You might also like to view...
An indifference curve shows the baskets of goods which
a. have the same marginal values. b. the consumer can purchase, given his income and the prices he faces. c. are the most preferred of the baskets within his budget. d. are all equally desirable, providing the consumer with some fixed level of satisfaction.
If the dollar value of a country's exports is greater than the value of its imports,
What will be an ideal response?
What does the specificfactors model allow us to analyze?
a. the returns to factors of production b. the allocation of resources between sectors c. the returns to factors of production and the allocation of resources between sectors d. the allocation of resources to the service sector
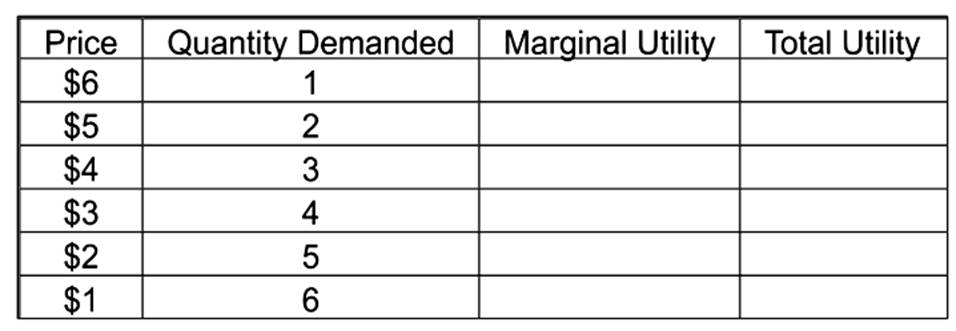
Suppose this table shows your demand schedule for tee shirts. (a) What is your total utility from three tee shirts? (b) What is your marginal utility from the third tee shirt? (c) If price were $2, how much would your consumer surplus be?