Determine what kind of function might be used as a model for the data.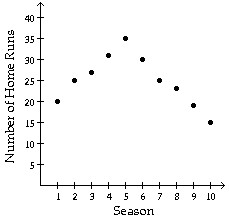
A. Linear: f(x) = mx + b
B. Quadratic: f(x) = ax2 + bx + c, a < 0
C. Quadratic: f(x) = ax2 + bx + c, a > 0
D. Polynomial, but neither quadratic nor linear
Answer: B
Mathematics
You might also like to view...
Use transformations to graph the function.f(x) = 2 - e-x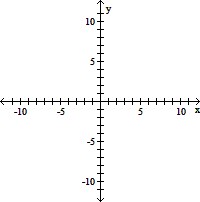
A. 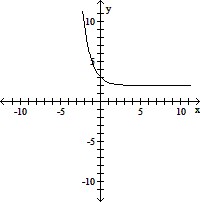
B. 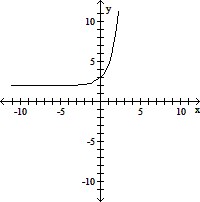
C. 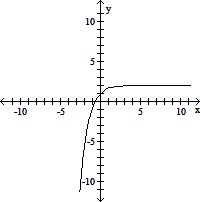
D. 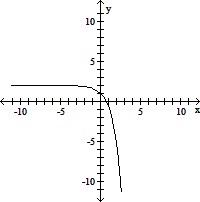
Mathematics
Combine like terms.4x + 15x
A. 38x B. 19x C. 19x2 D. 60x
Mathematics
Graph the inequality.0 < x < 4![]()
A. ![]()
B. ![]()
C. ![]()
D. ![]()
Mathematics
The graph that follows is the graph of a polynomial function. (i) What is the minimum degree of a polynomial function that could have the graph? (ii) Is the leading coefficient of the polynomial negative or positive? 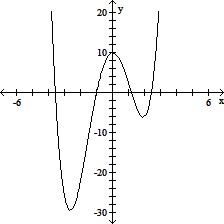
A. (i) 4 (ii) Negative B. (i) 3 (ii) Negative C. (i) 3 (ii) Positive D. (i) 4 (ii) Positive
Mathematics