The function f(x) =  FIGURE 1.png) is graphed below.
is graphed below.
 Figure 3.png)
c > 0
You might also like to view...
For the given graph: a) In words, describe the function shown on the graph. b) Find the slope of the graph and express it as a rate of change (be sure to include units). c) Briefly discuss the conditions under which a linear function is a realistic model for the given situation.
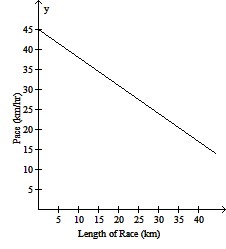
What will be an ideal response?
Multiply the polynomials using the FOIL method. Express the answer as a single polynomial in standard form.(x - 10)(x + 5)
A. x2 - 6x - 50 B. x2 - 5x - 5 C. x2 - 5x - 50 D. x2 - 50x - 5
Solve for the base. Round to the nearest cent.Part: $7,209.00 Rate of decrease: 33%
A. $7,209.00 B. $10,859.70 C. $10,759.70 D. $4,830.03
Without graphing, determine whether the following data set is exactly linear, approximately linear or nonlinear.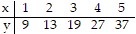
A. approximately linear B. nonlinear C. exactly linear