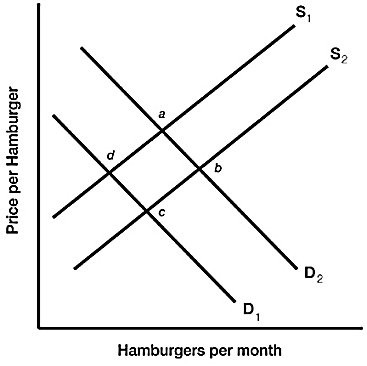
 Figure 3.6 illustrates a set of supply and demand curves for hamburgers. A decrease in demand and a decrease in quantity supplied are represented by a movement from:
A. point c to point a.
B. point a to point c.
C. point b to point c.
D. point d to point b.
Answer: C
You might also like to view...
What are the three types of financial institutions that accept deposits that are part of the U.S. money supply? Briefly describe each of the three types of financial institutions
What will be an ideal response?
Refer to Figure 21-1. Which of the following is consistent with the graph depicted above?
A) Households become spendthrifts and begin to save less. B) An expected recession decreases the profitability of new investment. C) The government runs a budget surplus. D) Technological change increases the profitability of new investment. Figure 21-2
Which retail operation would have the highest costs per book sold?
a. a small independent bookstore b. a large retail bookstore chain c. an Internet seller of books d. All would have the same costs.
The federal budget deficit topped $250 billion for the first time in fiscal year ________.
Fill in the blank(s) with the appropriate word(s).