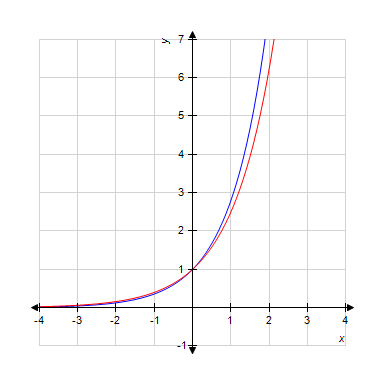
Given the graph of the functions  and
and  . Identify which graph corresponds to
src="https://sciemce.com/media/3/ppg__cognero__2.2_Exponential_Functions_and_Models__media__81fc78a0-b03d-4997-a2f0-daf763806bea.PNG" class="wirisformula" align="middle" style="vertical-align: middle;" data-wiris-created="true" varid="variable_id_field" variablename="impvar_c5ac757854644fbc95aa88305" />.
?
?
Select the correct answer.
?
A. Blue
B. Red
Answer: A
Mathematics
You might also like to view...
Evaluate the expression.-73
A. 21 B. -21 C. -343 D. 343
Mathematics
Find the intercepts, and then graph the line.2x - y = 4
A. (0, -4), (-2, 0)
B. (0, -4), (-4, 0)
C. (0, -4), (2, 0)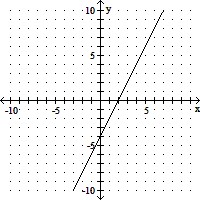
D. (0, -2), (4, 0)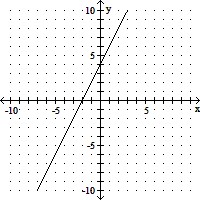
Mathematics
Calculate the value mentally.
A. 1,000 B. 100 C. none of these D. 10
Mathematics
Use the quotient rule to divide and simplify.
A. 
B. 
C. 
D. 
Mathematics