Graph the function using a graphing utility and the Change-of-Base Formula.y = log5(x + 4)
A. 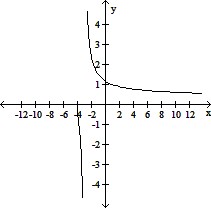
B. 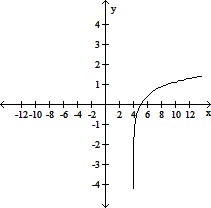
C. 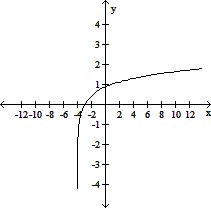
D. 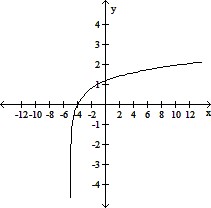
Answer: C
You might also like to view...
The following table shows the number M, in thousands, of magazine subscriptions t years after initial publication. Use exponential regression to find the yearly percentage decay rate for the number of subscriptions. Round your answer to two decimal places. t 1.88 5.61 8.98 12.49 15.89 M 6.03 2.66 1.98 1.28 0.84?
A. 14.45% B. 14.62% C. 13.00% D. 12.15%
Graph the function.y =  cos
cos  x
x
A. 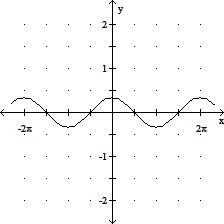
B. 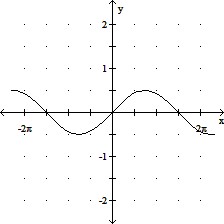
C. 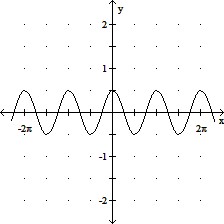
D. 
Use the Chain Rule to find  figure.png) where s = 4, t = 0.
where s = 4, t = 0.
 figure.png)
Solve by graphing.The cost y (in hundreds of dollars) of tuition at one community college is given by the linear equation  where x is the number of credits for which a student registers. Graph the equation and use the graph to estimate the cost of tuition if a student registers for 14 credits.
A. $2900 B. $2500 C. $1700 D. $1950