The following double-bar graph illustrates the revenue for a company for the four quarters of the year for two different years. Use the graph to answer the question.  What was the revenue for the fourth quarter of 2009?
A. $55 million
B. $11 million
C. $12 million
D. $60 million
Answer: A
Mathematics
You might also like to view...
Find the derivative of y with respect to the appropriate variable.y = (?2 + 4?) tanh-1 (? + 3)
A. (2? + 4) tanh-1 (? + 3) - 
B. - 
C. (2? + 4) - 
D. (2? + 4) tanh-1 (? + 3) - 
Mathematics
Rewrite the expression with a rational exponent.
A. 
B. 551/2
C. 552
D.  ? 55
? 55
Mathematics
Graph the function. Show at least one period.y = -3 cos(x - ?)
A. 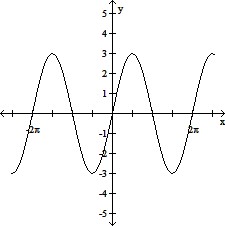
B. 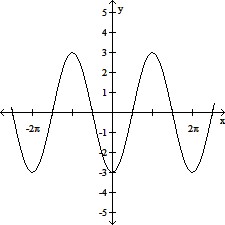
C. 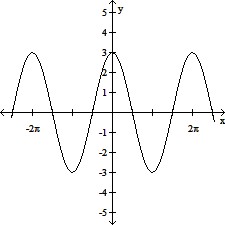
D. 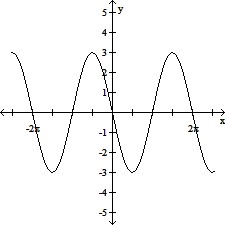
Mathematics
Simplify and write the answer using scientific notation.(6.22 × 10²)(6.50 × 10²)
A. 4.04 × 10⁵ B. 4.04 × 10⁴ C. 6.50 × 10⁴ D. 6.50 × 10⁵
Mathematics