The graph below shows the percentage of students enrolled in the College of Engineering at State University. Use the graph to answer the question.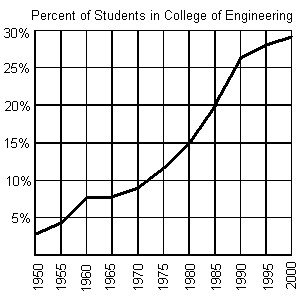 Between what two years is the difference in function values equal to 5%?
A. between 1980 and 1985
B. between 1960 and 1965
C. between 1985 and 1990
D. between 1970 and 1975
Answer: A
Mathematics
You might also like to view...
Find the limit. (26 - 3x)
A. -1 B. 1 C. -53 D. 53
Mathematics
Solve the problem.Let D be the smaller cap cut from a solid ball of radius 3 units by a plane 2 units from the center of the sphere. Set up the triple integral for the volume of D in cylindrical coordinates.
A. 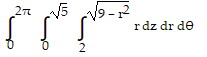
B. 
C. 
D. 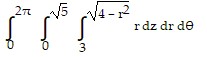
Mathematics
For the given geometric sequence, find the limit of the infinite series, if it exists. 2 ?  n - 1
n - 1
A. 4 B. 2 C. No limit D. 1
Mathematics
Provide an appropriate response.Solve the matrix equation:  =
= 
Fill in the blank(s) with the appropriate word(s).
Mathematics