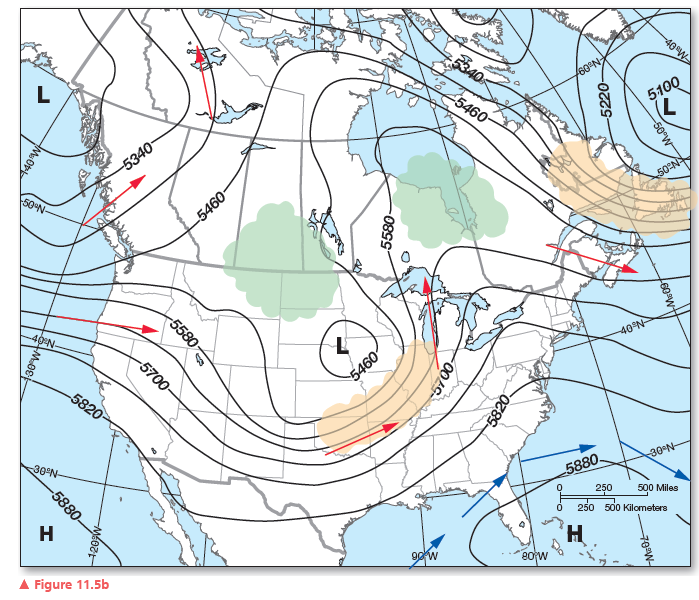
Figure 11.5b shows the 500-mb chart for the same day. The 500-mb chart shows the position of highand low-pressure regions and the pressure gradient. The 500-mb chart shows how many meters above sea level the 500-mb surface is rather than showing actual pressures, as the surface chart does. Draw two red arrows to show the direction of wind between the 5340 m and 5460 m height contours, and another two red arrows between the 5580 m and 5640 m height contours. Remember that wind flows parallel to the isobars in the upper atmosphere. Draw three blue arrows between the 5820 m and 5880 m contours to show the direction of wind flowing around the centers of high pressure. Using an orange pencil, shade at least two regions with closely spaced isobars, indicating a steep pressure gradient. Using a
green pencil, shade at least two regions with widely spaced isobars.
What will be an ideal response?

You might also like to view...
The age structure of a population is the number or percentage of
a. females under reproductive age b. females at reproductive age c. males age 15 to 44 d. persons of each sex in young, middle, and older age groups e. persons of each sex age 15 to 44
A cannonball shot from a cannon with a long barrel will have a greater muzzle velocity because the cannonball receives a greater
A) force. B) impulse. C) both A and B D) neither A nor B
Magenta light is really a mixture of
A) red and blue light. B) red and cyan light. C) red and yellow light. D) yellow and green light. E) none of the above
Which of the following is a method that governments use to improve urban transportation?
A) Provide motorcycle lanes in the center of rail lines. B) Provide bicycle lanes on freeways. C) Give tax rebates to people who use only public transportation. D) Designate lanes as carpool-only. E) Make some public buildings and some communities accessible only by public transportation.