Use the figure below to answer the following question.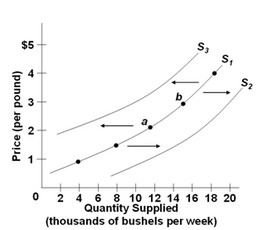 The diagram above shows three supply curves for apples. A movement from point a to point b is caused by a change in the
A. price of resources used to produce apples.
B. technology of apple farming.
C. number of apple farmers.
D. price of apples in the market.
Answer: D
You might also like to view...
In the U.S. in 2012 the percentage of the Americans living below the poverty line was about
A) 15 percent. B) 20 percent. C) 5 percent. D) 27 percent.
How can economists be confident that the pill itself is responsible for the increases in female labor force participation?
A. States that legalized the pill earlier also had earlier increases in female labor force participation. B. Starting from 1960, the year the pill was approved for sale, female labor force participation has been rising. C. States that legalized different versions of the pill had different patterns of female labor force participation. D. It seems to be common sense that delaying childbearing would increase labor force participation.
Suppose fairness is defined as those with the highest incomes can afford to pay a greater proportion of their income in taxes. Then which of the following taxation systems would be consistent with this notion of fairness?
A. A true flax tax. B. A flat sales tax on consumption purchases. C. A progressive tax on income. D. A fixed federal tax of $5,000 that everyone pays regardless of income status.
Because in any period of time and in any region the quantity of pollutants that can be absorbed by nature is fixed, the supply of pollutant rights will be perfectly elastic.
Answer the following statement true (T) or false (F)