Exhibit 4-3 Supply and demand curves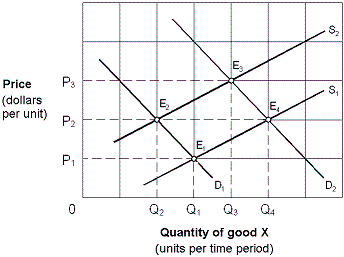
In Exhibit 4-3, which of the following might cause a shift from S2 to S1?
A. A decrease in input prices.
B. An improvement in technology.
C. An increase in input prices.
D. An increase in consumer income.
Answer: A
You might also like to view...
Use the following graph for a competitive market to answer the question below.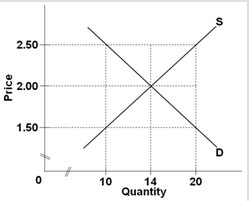 A black market where the price is $2.00 could result from a price
A. ceiling set at $2.50. B. floor set at $2.00. C. floor set at $1.50. D. ceiling set at $1.50.
When a good is taxed, the tax revenue collected by the government equals the decrease in the welfare of buyers and sellers caused by the tax
a. True b. False Indicate whether the statement is true or false
Based on the graph for the Gini Coefficient, as income inequality increases, Area A ______.
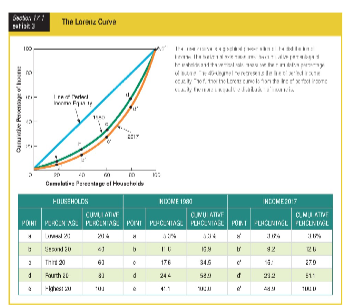
a. grows larger
b. grows smaller
c. disappears
d. divides into halves
Answer the next question based on the data provided in the tables below for two hypothetical nations, Wat and Xat. The nations have the following production possibilities for rice and corn:Wat's Production Possibilities ABCDEFRice7506004503001500Corn050100150200250Xat's Production Possibilities ABCDEFRice2,5002,0001,5001,0005000Corn0100200300400500Assume that Wat originally produced rice and corn at combination C and that Xat originally produced combination B. If the nations now fully specialized based on comparative advantage, the total gains from specialization and trade are
A. 50 units of rice and 50 units of corn. B. 100 units of rice and 150 units of corn. C. 100 units of rice and 100 units of corn. D. 25 units of rice and 25 units of corn.