Figure 36-5
?
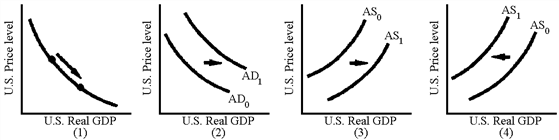
Which of the graphs in Figure 36-5 are consistent with an appreciation of the U.S. dollar caused by an increase in U.S. interest rates?
A. 1
B. 2
C. 3
D. 4
Answer: C
You might also like to view...
In effect, the U.S. does subsidize high-tech firms by subsidizing R&D. This is done through
A) the budget of the Department of Education. B) systematic protection through the levying of tariffs. C) systematic protection through the establishment of NTBs. D) relatively accelerated "depreciation" of R&D investment in the Federal tax codes. E) subsidies for high-tech firms.
Which of the following describes the relationship between the marginal product of labor and marginal costs?
a. Marginal product and marginal costs rise and fall in sync. b. When marginal product is rising, marginal costs are falling. c. Marginal costs must be known to figure marginal product. d. Marginal product equals change in marginal cost divided by output.
Which of the following is not likely to occur because of exchange rate fluctuations?
A. An end to flexible exchange rates worldwide. B. Inflation. C. An increase in the demand for imports. D. A decrease in the demand for exports.
In a simplified banking system subject to a 25 percent required reserve ratio, a $1,000 open-market purchase by the Fed would cause the money supply to:
A. increase by $1,000. B. decrease by $1,000. C. decrease by $4,000. D. increase by $4,000.