The graph shows the recorded hourly temperatures in degrees Fahrenheit at an airport. Use the graph to answer the question(s).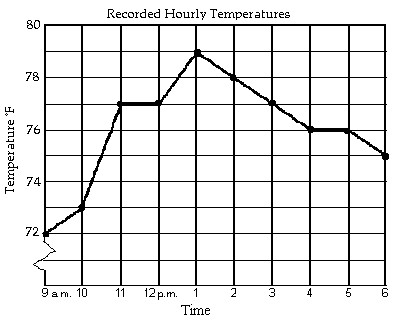 During which two hour period did the temperature increase the most?
A. 10 a.m. to 12 p.m.
B. 9 a.m. to 11 a.m.
C. 10 a.m. to 11 a.m.
D. 12 p.m. to 2 p.m.
Answer: B
Mathematics
You might also like to view...
Determine the quadrant(s) in which (x, y) is located so that the condition(s) is (are) satisfied. ? x< -8 and y< -6 ?
A. Quadrant I B. Quadrant I and II C. Quadrant III D. Quadrant II E. Quadrant IV
Mathematics
Determine whether the sequence of vertices is an Euler circuit. C ? D ? E ? B ? A ? E
A. No B. Yes
Mathematics
Solve the triangle. Round lengths to the nearest tenth and angle measures to the nearest degree.b = 5, c = 6, A = 70°
A. a = 5.4, B = 63°, C = 47° B. a = 7.4, B = 47°, C = 63° C. a = 6.4, B = 63°, C = 47° D. a = 6.4, B = 47°, C = 63°
Mathematics
The graph of the function f is shown below. Match the function g with the correct graph.g(x) = -f(-x) - 4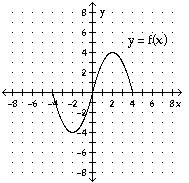
A. 
B. 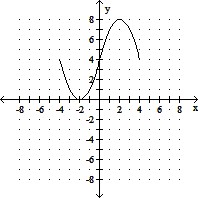
C. 
D. 
Mathematics