Suppose you produce 10 bikes a day for a total cost of $1000. Total costs increase to $1100 when you produce 15 bikes. Finally, total costs increase to $1300 if you make 20 bikes
A graph showing the relationship between total costs and the number of bikes produced would be A) a negatively-sloped line that becomes steeper.
B) a positively-sloped line that becomes steeper.
C) a negatively-sloped line that becomes flatter.
D) a positively-sloped line that becomes flatter.
B
You might also like to view...
Economies of scale can interfere with competition
Indicate whether the statement is true or false
Shuttle routes for colonial trade
a. lowered labor costs. b. reduced delays and costly extensions of port times. c. were more common than triangular trade patterns. d. allowed captains to negotiate with a small number of familiar trading partners. e. All of the above.
Which of the following is correct?
a. U.S. exports as a percentage of GDP have about tripled since 1950 . The U.S. currently has a trade deficit. b. U.S. exports as a percentage of GDP have about tripled since 1950 . The U.S. currently has a trade surplus. c. U.S. exports as a percentage of GDP have about doubled since 1950 . The U.S. currently has a trade deficit. d. U.S. exports as a percentage of GDP have about doubled since 1950 . The U.S. currently has a trade surplus.
Based on the graphic for perfect competition versus monopoly, the change between the welfare of perfect competition and the welfare of a monopoly is ______.
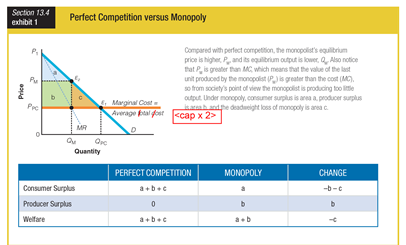
a. a
b. b
c. -c
d. -a