A study of consumers in an area found that as family income increased from $25,000 per year to $35, 000 per year, other factors held constant, the number of houses purchased increased from 7,000 per year to 11,000 per year. This finding indicates an income elasticity of demand coefficient for housing over this family income range of:
a. 0.22.
b. 0.75.
c. 1.33.
d. 4.50.
c
You might also like to view...
The demand and supply schedules for pizza are in the table above. A price ceiling of $4 per slice results in
A) a surplus of 20 slices of pizza. B) a shortage of 20 slices of pizza. C) a shortage of 40 slices of pizza. D) a shortage of 60 slices of pizza. E) neither a shortage nor a surplus.
Which of the following statements is a major criticism of a pure monopoly as a source of allocative inefficiency?
A. A pure monopoly fails to expand output to the level where the price of an additional unit is just equal to its marginal cost. B. A pure monopoly will always generate economic profit, and that means that prices are too high. C. A pure monopoly has an unfair advantage because it can purchase labor at a lower price than perfectly competitive firms can. D. A pure monopoly has no incentive to produce efficiently, because even the inefficient pure monopoly can be assured of economic profits.
Under President Lyndon Johnson, the federal government actually decreased its involvement in the economy.
Answer the following statement true (T) or false (F)
Refer to the information provided in Figure 23.11 below to answer the question(s) that follow.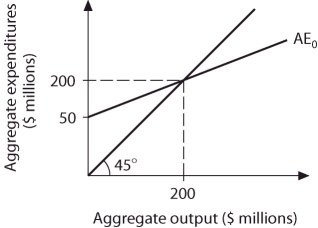 Figure 23.11Refer to Figure 23.11. Equilibrium aggregate output will increase to $250 million if the
A. multiplier increases to 8. B. MPC increases to 0.8. C. MPS increases to 0.8. D. all of the above.