Solve the problem.The graph below shows the number of tuberculosis deaths in the United States from 1989 to 1998.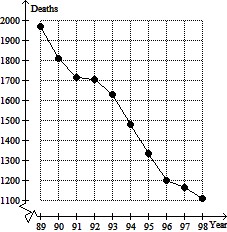 Estimate the average rate of change in tuberculosis deaths from 1993 to 1995.
A. About -150 deaths per year
B. About -1 deaths per year
C. About -300 deaths per year
D. About -80 deaths per year
Answer: A
Mathematics
You might also like to view...
Rationalize the denominator. Assume that all variables represent positive real numbers.
A. 133
B. 12
C. 
D. 
Mathematics
Provide an appropriate response.Choose the expression that is equivalent to the following: 20x + 5y
A. 5(15x + y) B. 5(4x + y) C. 25xy D. 5(4x + 5y)
Mathematics
Simplify.(-i)31
A. -i B. 1 C. i D. -1
Mathematics
Find the slope of the line.
A. -9 B. 0 C. undefined slope D. 2
Mathematics