Which of the following changes to the market in the graph shown could cause the price ceiling to become non-binding?
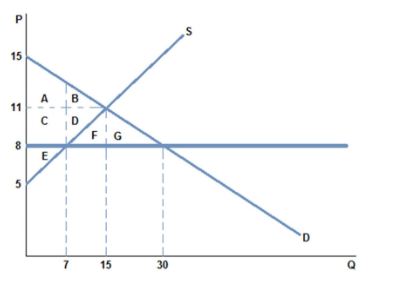
A. Demand could increase, and shift to the right.
B. Supply could increase, and shift to the left.
C. Supply could increase, and shift to the right.
D. Supply could decrease, and shift to the left.
C. Supply could increase, and shift to the right.
You might also like to view...
Use the figure below to answer the following question.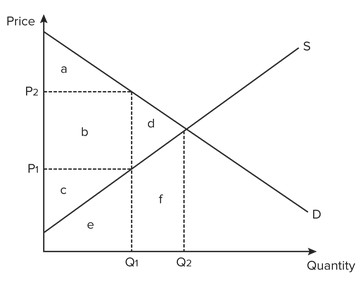 If actual production and consumption occur at Q1 and the price is P2
A. deadweight loss equals area f. B. producer surplus equals area c. C. producer surplus equals area c + b. D. consumer surplus equals area a + b.
The primary purpose of ________ is to encourage the expenditure of funds on research and development to create new products
A) patents and copyrights B) nationalizing oil companies C) government-run health care D) centrally planned economies
A perpetuity for sale at $100,000 that promises a yearly payment of $5,000 has an effective yield of
A) 2%. B) 5%. C) 20%. D) 50%. E) 2,000%.
A strategy that is best for a player regardless of the strategy of the other player is called a(n)
a. subsistence strategy b. determinant strategy c. dominant strategy d. independent strategy e. autonomous strategy