Exhibit 5-9 Supply and Demand Curves for Good X
?
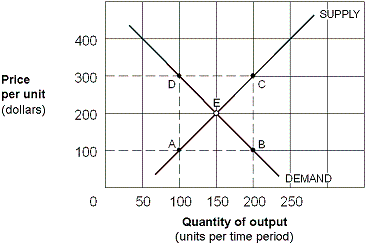
As shown in Exhibit 5-9, the price elasticity of demand for good X between points E and B is:
A. 3/7 = 0.43.
B. 7/3 = 2.33.
C. 1/2 = 0.50.
D. 1.
Answer: A
You might also like to view...
Dead capital is most likely to exist when
A) there are restrictions on imports. B) residents of a country face barriers to establishing legal ownership of resources. C) property rights are well-defined. D) there are restrictions on exports.
Refer to Figure 11-15. What is the combination of inputs that produces 200 gooseberry pies at the lowest cost?
A) combination e: 10 hours of labor and 48 units of capital B) combination f: 40 hours of labor and 24 units of capital C) combination g: 60 hours of labor and 14 units of capital D) combination h: 60 hours of labor and 9 units of capital
In the absence of property rights, inventors have ________ incentive to invest in innovations and ________ incentive to disclose how to use and make their innovations.
A) less; less B) more; less C) more; more D) less; more
Assume that a perfectly competitive increasing-cost industry is in long-run equilibrium when market demand suddenly increases. Which of the following statements is not correct?
a. Existing firms will earn economic profits in the new long-run equilibrium b. Existing firms will increase output in the short run c. New firms will enter the industry in the long run d. Some resource suppliers to the industry will earn higher income e. The new long-run equilibrium price will exceed the original equilibrium price