The graph below shows the percentage of students enrolled in the College of Engineering at State University. Use the graph to answer the question.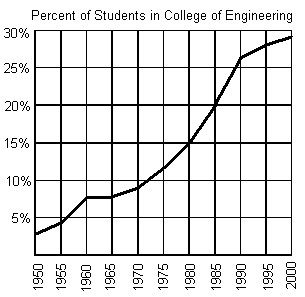 Between what two years is the difference in function values equal to 5%?
A. between 1980 and 1985
B. between 1970 and 1975
C. between 1960 and 1965
D. between 1985 and 1990
Answer: A
You might also like to view...
Use logarithmic differentiation to find the derivative of y with respect to the independent variable.y = (sin x)cos x
A. cos x cot x - ln (sin x) B. cos x ln ( sin x) C. (sin x)cos x(cos x cot x - sin x ln (sin x)) D. cos x cot x - sin x ln(sin x)
Factor the expression completely.435 + 202t - 16t2 (projectiles)
A. (29 - 4t)(15 + 4t) B. (29 - 2t)(15 + 8t) C. (29 + 2t)(15 - 8t) D. (15 - 2t)(29 + 8t)
Refer to the double-bar graph below which shows the number of male and female athletes at a university over a four-year period. Solve the problem.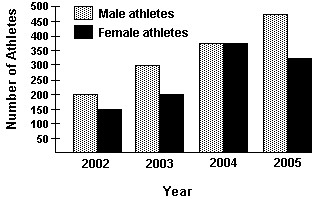 Find the increase in the number of female athletes from 2003 to 2005.
A. 225 B. 150 C. 125 D. 175
Perform the indicated operations.(9x4 + 3xy - y3) - (x4 + 5xy + 3y3)
A. 9x4 - 2xy - 4y3 B. 8x4 - 2xy - 2y3 C. 10x4 + 13xy + 2y3 D. 8x4 - 2xy - 4y3