Refer to Figure 7.6. Graph A represents:
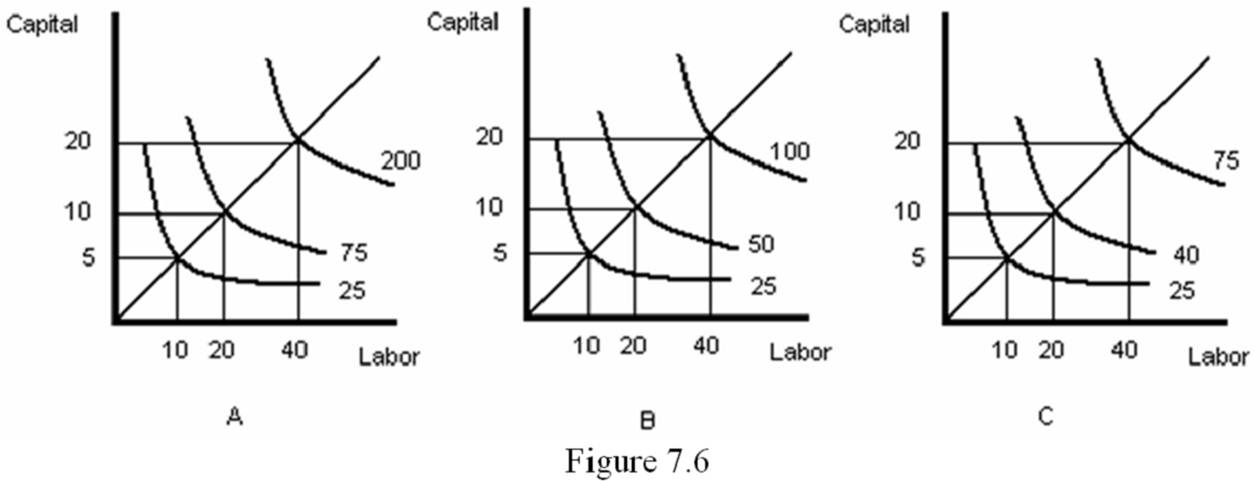
A. increasing returns to scale.
B. decreasing returns to scale.
C. constant returns to scale.
D. diminishing marginal returns.
A. increasing returns to scale.
You might also like to view...
The general public disapproved of key features of the 1996 welfare legislation
Indicate whether the statement is true or false
The result of effective screening and signaling can be:
A. more transactions take place. B. surplus is increased for buyer and/or seller. C. more information is credibly shared. D. All of these statements are true.
If a consumer is buying three goods A, B, and C, then she will be in equilibrium when total utility from each good is equal
a. True b. False Indicate whether the statement is true or false
Explain how, according to the theory of PSST (patterns of specialization and sustainable trade), economic activity can decline in the face of unchanged aggregate demand. Give a hypothetical example to help support your answer