This graph demonstrates the domestic demand and supply for a good, as well as a tariff and the world price for that good.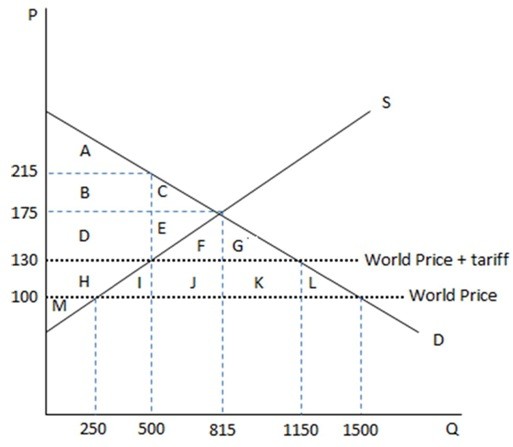 According to the graph shown, the amount of deadweight loss created by the imposition of a tariff is area:
A. JK
B. IJKL
C. IL
D. FGJK
Answer: C
You might also like to view...
Although open market operations and discount loans both change the monetary base, the Fed has
A) greater control over open market operations than over discount loans. B) greater control over discount loans than over open market operations. C) very little control over either discount loans or open market operations. D) complete control over both discount loans and open market operations.
Which of the following is most likely to be sold in an oligopoly market?
A) pizza B) cell phone service C) electricity D) cotton
In order to maximize profits, the derivative of total revenue with respect to quantity must equal the derivative of total cost with respect to quantity
Indicate whether the statement is true or false
Suppose that an economy can produce various combinations of fish and bread. If more people with strong fishing skills became employed in this economy, how would the production possibilities curve (PPC) change?
a. The PPC would shift outward on the fish axis, but would not change on the bread axis. b. The PPC would shift inward equally along both the fish and the bread axes. c. The PPC would shift outward equally along both the fish and the bread axes. d. The PPC would shift inward on the bread axis, but would not change on the fish axis.