Graph the circle.y = 
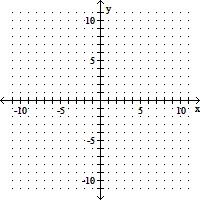
A. 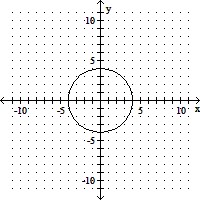
B. 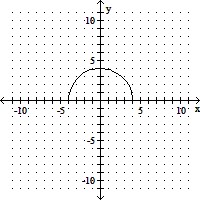
C. 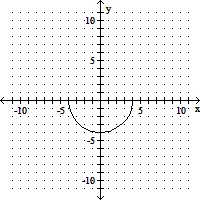
D. 
Answer: B
You might also like to view...
The bar graph shows the number of tickets sold each week by the garden club for their annual flower show.?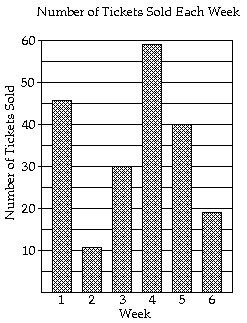 During which week did the garden club sell the fewest tickets?
A. week 4 B. week 2 C. week 6 D. week 5
Solve. If necessary, round percents to the nearest tenth, dollar amounts to the nearest cent, and all other numbers to the nearest whole.The mosquito population within a defined area is estimated at 35 million. Due to weather conditions, it is projected that this population will increase by 80%. Find the increase and the projected population.
A. increase: 2,800 million mosquitos projected population: 2,835 million mosquitos B. increase: 2,800 million mosquitos projected population: 2,765 million mosquitos C. increase: 28 million mosquitos projected population: 7 million mosquitos D. increase: 28 million mosquitos projected population: 63 million mosquitos
Find the smallest integer k ? 0 such that adding k to each entry of the given matrix produces a matrix with all positive payoffs.
A. 4 B. 1 C. 2 D. 3
Solve the problem.Let y1 equal the left side and let y2 equal the ride side of the given equation. Graph y1 and y2 and use the graph to solve the equation x - 3 = -2.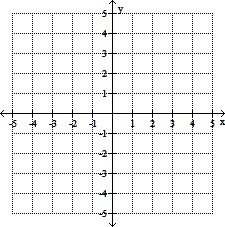
A. 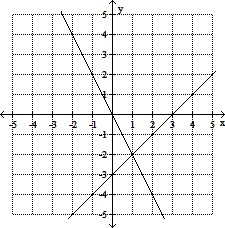
x = 1
B. 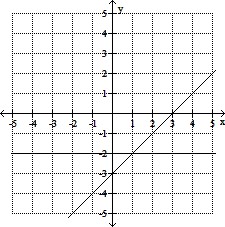
x = 1
C. 
x = 5
D. 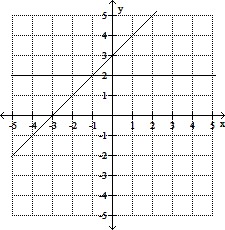
x = -1