According to the graph shown, the change in producer surplus brought about by the introduction of a tariff is:
This graph demonstrates the domestic demand and supply for a good, as well as a tariff and the world price for that good.
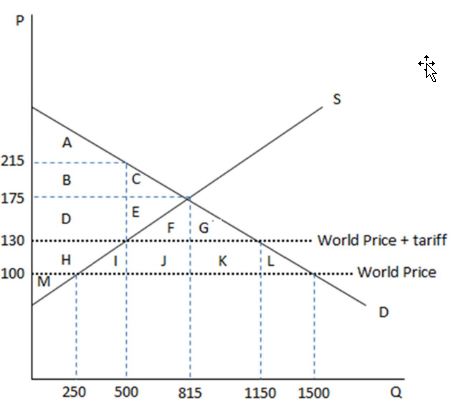
A. a loss of HIJKL.
B. an increase of HIJKL.
C. a loss of H.
D. an increase of H.
D. an increase of H.
You might also like to view...
Consider the market for ride-on lawn mowers and the recent increases in the price of oil. The recent increase in the price of oil makes it more expensive to manufacture ride-on lawn mowers. An increase in the price of oil also makes it more expensive to run a ride-on mower. If the price of oil increases, the demand for ride-on mowers will ______ and the supply will _______.
A. increase; increase B. decrease; decrease C. increase; decrease D. decrease; increase
Which of the following is not an argument in favor of reforming the tax laws to encourage saving?
a. Saving is a key determinant of long-run prosperity. b. Current tax laws discourage saving for the purpose of leaving a large bequest. c. The substitution effect of a higher return to saving may be about equal to the income effect of a higher return to saving. d. The tax code currently taxes some forms of capital income twice.
A year-long drought that destroys most of the summer's crops would be considered a:
A. short-run supply shock. B. long-run demand shock. C. long-run supply shock. D. short-run demand shock.
Compare market price and quantity to socially optimal price and quantity if hog farmers ignore the polluting effect of hog waste on nearby waterways. Use a graph to assist in your explanation.
What will be an ideal response?