The following graph depicts demand.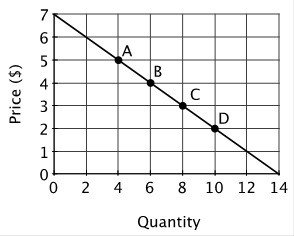 The slope of the demand curve (ignoring the negative sign) is:
A. 1.
B. 2.
C. 0.5.
D. 1.5.
Answer: C
You might also like to view...
Refer to the below graphs. (Assume that the pre-migration labor force in Country A is 0d and that it is 0u in country B.) The migration of labor from low-income country B to high-income country A will:
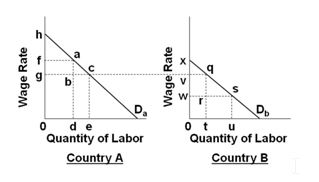
A. Increase domestic output in both countries
B. Decrease domestic output in both countries
C. Increase domestic output in country A and decrease domestic output in country B
D. Decrease domestic output in country A and increase domestic output in country B
A ________ describes the possible moves in a game in sequence and lists the payoffs to each possible combination of moves.
A. game graph B. multi-period game C. payoff matrix D. decision tree
Why do policymakers sometimes use policies to limit growth?
What will be an ideal response?
Provide three examples of scarcity that illustrate why even the 1,210 billionaires in the world face scarcity
What will be an ideal response?