Solve the problem.Suppose that the speed of a car, measured in miles per hour (mph), is monitored for some short period of time after the driver applies the brakes. The following table and graph relate the speed of the car to the amount of time, measured in seconds (sec), elapsed from the moment that the brakes are applied.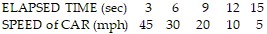
 Is the slope of the graph positive or negative and is the slope constant, or does it change over time?
A. Negative, constant
B. Negative, changes over time
C. Positive, changes over time
D. Positive, constant
Answer: B
Mathematics
You might also like to view...
The letters x and y represent rectangular coordinates. Write the equation using polar coordinates (r, ?).x2 = 4y
A. 4 cos2 ? = r sin ? B. 4 sin2 ? = r cos ? C. r sin2 ? = 4 cos ? D. r cos2 ? = 4 sin ?
Mathematics
Graph the function.f(x) = 
A. 
B. 
C. 
D. 
Mathematics
Find the midpoint of the line segment whose end points are given.(3,  ) and (4,
  )
)
A. (7,  )
)
B. ( , -
, -  )
)
C. ( ,
,  )
)
D. (-  ,
,  )
)
Mathematics
Determine whether the graph of the given function is symmetric with respect to the y-axis, symmetric with respect to the origin, or neither.f(x) = -9x5 - 3x3
A. y-axis B. Origin C. Neither
Mathematics