Use the graph to solve the equation or inequality. If appropriate, write your answer in interval notation.y1 = 2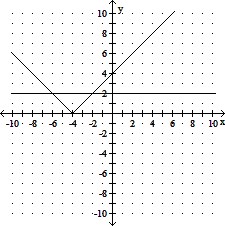
A. 2, -2
B. -6, 2
C. 2
D. -6, -2
Answer: D
You might also like to view...
Construct a pie chart representing the given data set.Main form of exercise for employees of one company:None:30%Walking:18%Running:4%Golf:11%Weight Training:26%Other:11%
A. 
B. 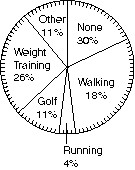
C. 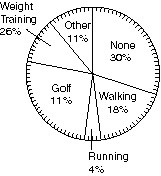
D. 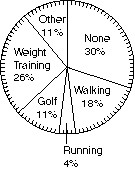
Use an integer or rational number to express the number representing change.During one year, 34 employees quit their jobs at Newline Manufacturing Company.
A. 34 B. -34
Decide whether the relation is a function.{(-5, 8), (-3, -3), (-1, -5), (-1, -7)}
A. function B. not a function
Prepare a probability distribution for the experiment. Let x represent the random variable, and let P represent the probability.Two marbles are drawn from a bag in which there are 4 red marble and 2 blue marble. The number of blue marbles is counted.
A. 
B. 
C. 
D. 