According to the graph shown, if the economy decides to impose a tariff, the government can expect to raise how much in government revenues?
This graph demonstrates the domestic demand and supply for a good, as well as a tariff and the world price for that good.
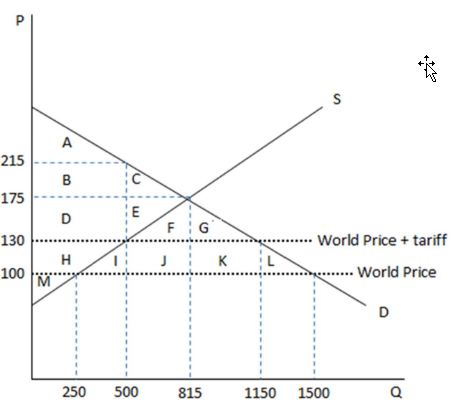
A. $19,500.
B. $27,000.
C. $34,500.
D. $37,500.
A. $19,500.
You might also like to view...
When government decides to increase spending, interest rates generally ________ and this change in interest rates ________ investment spending
A) increase; increases B) increase; decreases C) decrease; increases D) decrease; decreases
Refer to the figure above. The deadweight cost of the tariff equals
A) $10,000. B) $25,000. C) $50,000. D) cannot be calculated without further information.
Moral hazard occurs when the parties on once side of the market, who have information not known to others, self select in a way that adversely affects the parties on the other side of the market.
Answer the following statement true (T) or false (F)
Assume two goods are substitutes. Ceteris paribus, a decrease in the price of one good will cause the equilibrium price of the other good to
A. Decrease and the equilibrium quantity of the other good to decrease. B. Decrease and the equilibrium quantity of the other good to increase. C. Increase and the equilibrium quantity of the other good to decrease. D. Increase and the equilibrium quantity of the other good to increase.