Refer to Figure 7-2. Without the tariff in place, the United States produces
A) 12 million pounds of coffee. B) 26 million pounds of coffee.
C) 33 million pounds of coffee. D) 45 million pounds of coffee.
A
You might also like to view...
Suppose that when the price of oranges is $3 per pound, the quantity demanded is 4.7 tons per day and the quantity supplied is 3.9 tons. In this case:
A. excess demand will lead the price of oranges to rise B. excess supply will lead the price of oranges to rise C. excess supply will lead the price of oranges to fall D. excess demand will lead the price of oranges to fall
In this graph, what does Y represent?
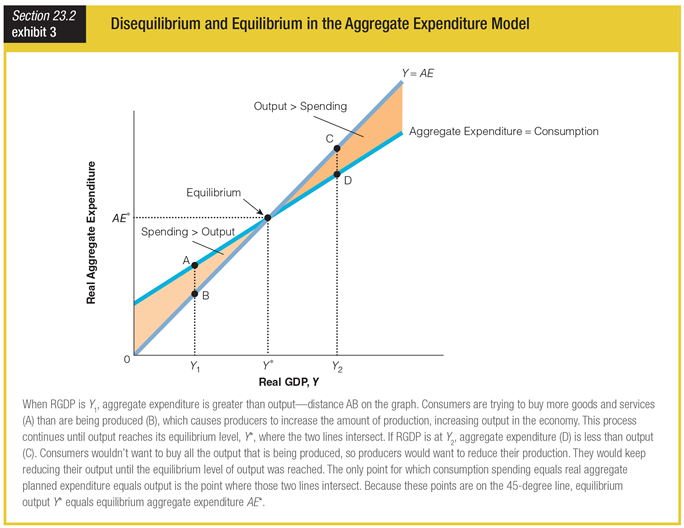
a. demand
b. output
c. spending
d. consumption
Exhibit 4-2 Supply and demand curves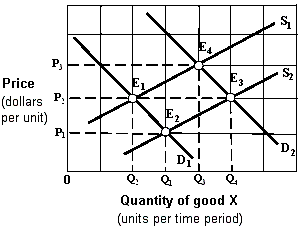 Beginning from an equilibrium at point E1 in Exhibit 4-2, an increase in demand for good X, other things being equal, would move the equilibrium point to:
A. E1, no change. B. E2. C. E3. D. E4.
In Porter's model of the determinants of national competitive advantage, he noted many US firms were led by people with ______ backgrounds, likely leading to US firms' lack of attention to improving manufacturing process and product design.
Fill in the blank(s) with the appropriate word(s).