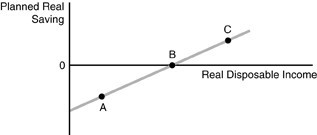
 Refer to the above figure. The figure represents the saving function for the consumer. Point A represents
A. the amount of autonomous consumption.
B. a situation in which saving is positive.
C. a situation in which saving is negative.
D. the point at which saving equals zero.
Answer: C
You might also like to view...
For the top 1 percent of income distribution, the share of federal individual income taxes paid by households in this group in 2015 was ________ percent
A) 9 B) 17 C) 44 D) 68
Banks responded to disintermediation by
A) supporting the elimination of interest rate regulations, enabling them to better compete for funds. B) opposing the elimination of interest rate regulations, as this would increase their cost of funds. C) demanding that interest rate regulations be imposed on money market mutual funds. D) supporting the elimination of interest rate regulations, as this would reduce their cost of funds.
M1 is comprised of currency held outside banks + traveler's checks + __________
A) credit cards B) savings deposits C) gold D) checkable deposits E) money market mutual funds
Suppose that Brazil is capital abundant and Chile is natural resource abundant. If timber is natural resource intensive and computers are capital intensive, then according to the Stolper-Samuelson Theorem, the incomes of the owners of ________ are likely to rise in Brazil after trade with Chile begins.
A) capital
B) labor
C) natural resources
D) It is impossible to determine which will be favored.