Exhibit 14-3 Aggregate supply and demand curves
?
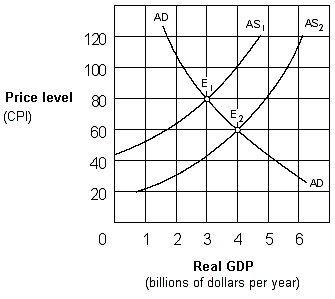
In Exhibit 14-3, the change in equilibrium from E1 to E2 represents:
A. deflation.
B. demand-pull inflation.
C. price-push inflation.
D. cost-push inflation.
Answer: A
You might also like to view...
The property of society getting the most it can from its scarce resources is called
a. efficiency. b. equality. c. externality. d. productivity.
In the poorest nations, agriculture is likely to contribute as much as ________ percent to total output.
A. 55 B. 10 C. 30 D. 85
Refer to the information provided in Figure 6.1 below to answer the question(s) that follow.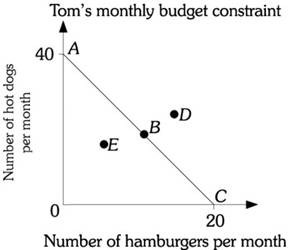 Figure 6.1Refer to Figure 6.1. Assume Tom is on budget constraint AC and the price of a hot dog is $5.00. Tom's monthly income is
A. $40. B. $100. C. $200. D. $400.
Refer to the above table. If planned investments were fixed at $16, taxes were zero, government purchases of goods and services were zero, and net exports were zero, then equilibrium real GDP would be $630 initially. If government purchases were then raised from $0 to $10, and lump-sum taxes also increased from $0 to $10, other things constant, then the equilibrium real GDP would become:
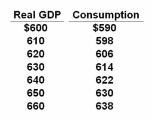
The table shows the consumption schedule for a hypothetical economy. All figures are in billions of dollars.
A. $660
B. $630
C. $640
D. $650