Graph the inequality.y ? 2x
A. 
B. 
C. 
D. 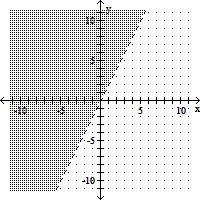
Answer: A
You might also like to view...
Solve the problem.The figure shows two intersections, labeled A and B, that involve one-way streets. The numbers and variables represent the average traffic flow rates measured in vehicles per hour. For example, an average of 600 vehicles per hour enter intersection A from the west, whereas 250 vehicles per hour enter this intersection from the north. A stoplight will control the unknown traffic flow denoted by the variables x and y. Use the fact that the number of vehicles entering an intersection must equal the number leaving to determine x and y.
A. x= 250, y = 150 B. x= 600, y = 500 C. x= 400, y = 450 D. x= 450, y = 400
Determine whether the graphs of the equations are parallel lines, perpendicular lines, or neither. 6x + 2y = 824x + 8y = 33
A. Neither B. Perpendicular C. Parallel
Sketch the graph of the parabola.y = x2 - 3
A. 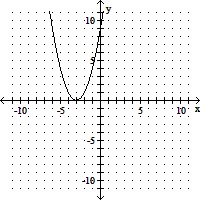
B. 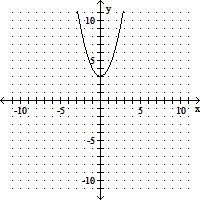
C. 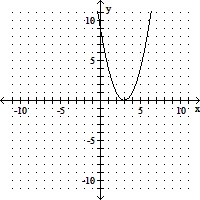
D. 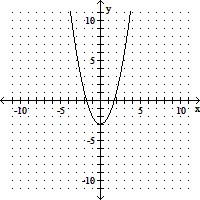
Solve the problem.Two pipes together can fill a large tank in 10 hr. One of the pipes, used alone, takes 15 hr longer than the other to fill the tank. How long would each pipe take to fill the tank alone?
A. 25 hr; 40 hr B. 15 hr; 30 hr C. 12.5 hr; 27.5 hr D. 10 hr; 25 hr