Exhibit 4-8 Demand and supply curves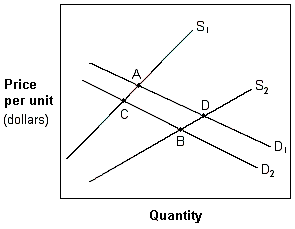
In Exhibit 4-8, a movement from A to B in which price has decreased and quantity has increased is best explained by a(n):
A. increase in supply and demand.
B. decrease in supply and demand.
C. increase in supply that dominates a decrease in demand.
D. increase in demand that dominates a decrease supply.
Answer: C
You might also like to view...
The increase in spending that occurs because the demand for investment goods increases when the price level falls is known as the
A) price effect. B) international trade effect. C) wealth effect. D) interest rate effect.
The chief executive officer of a monopoly firm gives a directive to his production managers to maximize the per unit profit for the upcoming fiscal year. Evaluate the economic wisdom of this advice
What will be an ideal response?
When the government runs a budget deficit, we would expect to see that
A) public saving is positive. B) private saving will fall. C) G + TR < T. D) investment will fall.
When comparing across countries, the higher the rate of saving
A) the lower the level of per capita real Gross Domestic Product (GDP). B) the higher the level of per capita real Gross Domestic Product (GDP). C) the less industrialized the country. D) the lower the productivity rates.