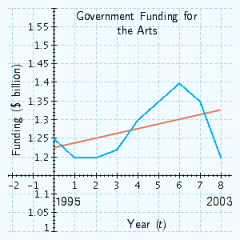
The chart shows the total annual support for the arts in the U.S. by federal, state, and local government in 1995-2003 as a function of time in years ( represents 1995) together with the regression line.
?
?
Over the period  the average rate of change of government funding for the arts was _____ the rate predicted by the regression line.
?
A. greater than
B. less than
C. equal to
Answer: C
Mathematics
You might also like to view...
Determine the radius of convergence of the power series.
A. ? B. 8 C. 4 D. 0
Mathematics
Use this graph to answer the question.

 MonthWhat were the total sales for the first 6 months of 2010?
A. $64,000 B. $366,000 C. $286,000 D. $302,000
Mathematics
Find the GCF of the given terms.34y3 and 85y2
A. 170y3 B. 17y3 C. 170y2 D. 17y2
Mathematics
Divide. Leave your answer in trigonometric form.
?

What will be an ideal response?
Mathematics