The table shows, for some particular year, a listing of several income levels and, for each level, the proportion of the population in the level and the probability that a person in that level bought a new car during the year. Given that one of the people who bought a new car during that year is randomly selected, find the probability that that person was in the indicated income category. Round your answer to the nearest hundredth. 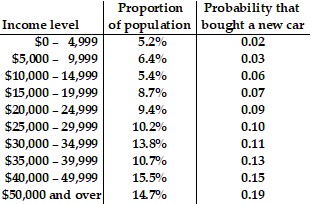 $50,000 and over
A. 0.28
B. 0.24
C. 0.22
D. 0.25
Answer: D
You might also like to view...
Solve the problem.If an object has a 240° clockwise rotation as one of its symmetries, then it must also have as a symmetry
A. a 120° clockwise rotation. B. a 90° clockwise rotation. C. a 90° counterclockwise rotation. D. a 180° rotation. E. none of these
Provide an appropriate response.The revenue R for a product is given by R(x) = 1750x - x2 where x is the number of units sold. Is this function continuous for x = 100?
What will be an ideal response?
Identify the quadrant for the angle ? satisfying the following conditions.cot ? < 0 and cos ? > 0
A. Quadrant IV B. Quadrant II C. Quadrant III D. Quadrant I
Answer the question.Use the equation 5x2 - 2x = c to explain how to solve a quadratic equation by completing the square.
What will be an ideal response?