Draw a scatter diagram and find ?r for the data shown in the table.
xy130424416714911?
A. 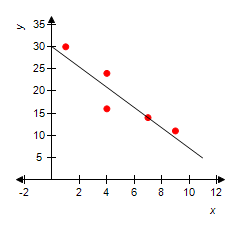
?

?
B. ?

?

?
C.

?
?
?
D.

?

?
E.

?

?
Answer: A
You might also like to view...
Solve the problem. The following data shows the number of housing starts in various years in one beachside community. 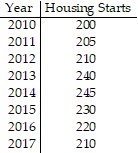 Let f(t) be the number of housing starts at t years since 2009. The data can be modeled by the quadratic model
  . Use the model to predict the number of housing starts in the year 2021.
A. 102 B. 97 C. 104 D. 100
Solve the problem. Suppose a student plans to drive from his home to New Haven 75 miles on a divided highway and 30 miles on an undivided highway. The speed limit is 70 mph on the divided highway and 50 mph on the undivided highway. Assume the driver drives nonstop. Let T(a) represent the driving time (in hours) if the student drives at a mph above the speed limits. Find T(0). What does your result mean in terms of the trip?
A. 1.45; If the student drives at the speed limits the trip will take 1.45 hours. B. 1.67; If the student drives at the speed limits the trip will take 1.67 hours. C. 1.45; If the student drives at 1.45 mph above the speed limits, the trip will take 1.45 hours. D. 1.67; If the student drives at 1.67 mph above the speed limits, the trip will take 1.67 hours.
Provide an appropriate response.Solving for which variable in which equation involves the least amount of work? 7x - 5y = 19-12x - 6y = -120
A. x in equation 2 B. x in equation 1 C. y in equation 1 D. y in equation 2
Write  using positive rational exponents.
A. 
B. 
C. 
D. 
E. 