Use the information given to draw a bar graph. Clearly label the bars. Make a vertical bar graph to illustrate the data in the table below. Entree Choices of Customers During One Year 
What will be an ideal response?
Answers may vary. The following is a possible answer. 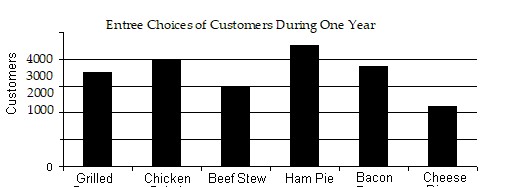
Mathematics
You might also like to view...
Solve by transforming the augmented matrix into row echelon form.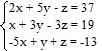
A. (4, 1, 6) B. no solution C. (4, 6, 1) D. (-4, 6, 8)
Mathematics
Find the percent increase or decrease.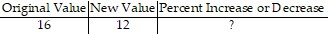
A. 15% increase B. 25% decrease C. 20% decrease D. 15% decrease
Mathematics
Find the exact value of the logarithmic expression.log4 
A. 3
B. -3
C. 
D. - 
Mathematics
Find the perimeter.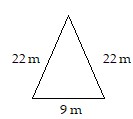
A. 99 m B. 44 m C. 51 m D. 53 m
Mathematics