The following table shows the number C, in millions, of cars sold in the U.S. t years after 2005. Use the regression line for the data to estimate the number of cars sold in 2013.
t 0 1 3 5 C 5.54 5.46 5.24 4.54?
?
A. 3.70 million
B. 4.92 million
C. 3.16 million
D. 4.11 million
Answer: D
You might also like to view...
The equation of an ellipse is given. Put the equation in standard form and sketch the ellipse.9x2 + 49y2 = 441
A.  +
+  = 1
= 1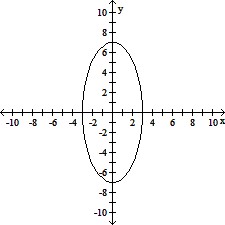
B.  +
+  = 1
= 1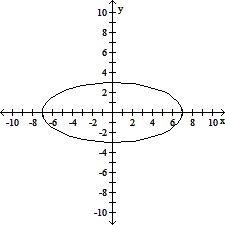
C.  +
+  = 1
= 1
D.  +
+  = 1
= 1
Sketch the graph of the equation. Identify the vertex and the intercepts.y = x2 - 2x + 6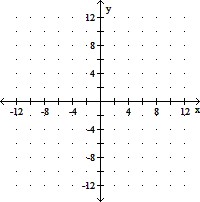
A. Vertex: (1, -1);
x-intercepts: (0, 0) and (2, 0);
y-intercept: (0, 0)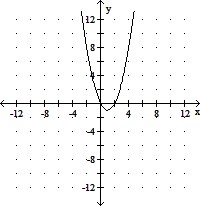
B. Vertex: (1, -5);
x-intercepts: none;
y-intercept: (0, -6)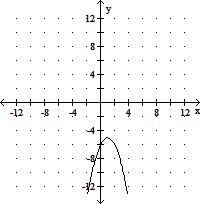
C. Vertex:  ;
;
x-intercepts: (1, 0) and (6, 0);
y-intercept: (0, 6)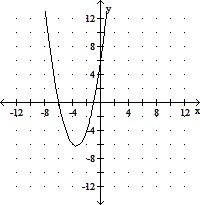
D. Vertex: (1, 5);
x-intercepts: none;
y-intercept: (0, 6)
Perform the indicated conversion between American and metric units of length.42 inches to centimeters (Round to the nearest hundredth.)
A. 3.50 B. 106.68 C. 138.60 D. 16.54
Solve the problem.The equation of a line is y =  x. What is the slope of a line perpendicular to it?
A. - 
B. - 2
C. 
D. 0