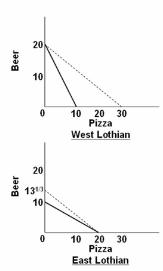
Refer to the diagrams. The solid lines are production possibilities curves; the dashed lines are trading possibilities curves. The trading possibilities curves imply that:
A. both countries have a trade surplus that will result in economic growth.
B. the domestic production possibilities curves entail unemployment and/or the domestic
misallocation of resources.
C. world resources will be allocated more efficiently if the two nations specialize and trade based on comparative advantage.
D. both nations will be worse off as a result of international specialization and trade.
C. world resources will be allocated more efficiently if the two nations specialize and trade based on comparative advantage.
You might also like to view...
Actions based on the more general Pareto criteria are preferable to actions based on application of interpersonal utility calculations
a. True b. False
Assume the market is in equilibrium in the graph shown at demand D and supply S1. If the supply curve shifts to S2, and a new equilibrium is reached, which of the following is true?
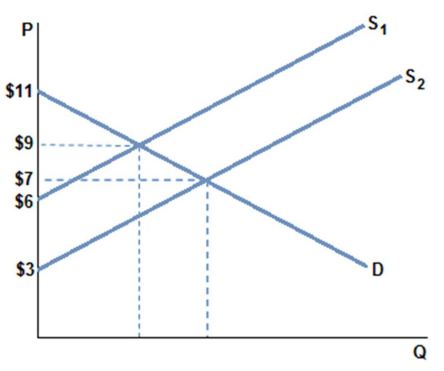
A. Consumer surplus increases, and total surplus increases.
B. Consumer surplus decreases, and total surplus increases.
C. Consumer surplus increases, and total surplus decreases.
D. Consumer surplus decreases, and total surplus decreases.
Large income differences will be eradicated if the market mechanism is working well
a. True b. False Indicate whether the statement is true or false
Consider an industry with two firms producing similar products. Each firm's total cost (in dollars) is given below.Acme Manufacturing: TC = 100 + 3Q Generic Industries: TC = 500 + 3Q When each firm is producing the same quantity, Acme's average total cost is:
A. lower than Generic's average total cost at some levels of output, and higher than Generic's average total cost at other levels of output. B. lower than Generic's average total cost. C. equal to Generic's average total cost. D. higher than Generic's average total cost.