In Figure 4.2, one possible explanation for the increase in the interest rate from i1 to i2 is
A) an increase in economic growth.
B) an increase in government budget deficits.
C) a decrease in government budget deficits.
D) a decrease in economic growth.
E) a decrease in the riskiness of bonds relative to other investments.
A
You might also like to view...
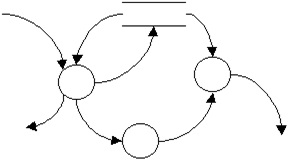
Refer to the figure. What are the immediate predecessor(s) of activity D?
A) B and C B) B C) C D) C and E E) B and E
The broad categories of life insurance products including which of the following?
A) Term B) Whole life C) Universal life D) All of the above
The __________ function in Excel is used to compute the statistics required to create a histogram
a. NORM.INV b. RAND c. FREQUENCY d. STDEV.S
Which statement concerning the following diagram 1.0 logical data flow diagram (DFD) is true?
?
 ?
?
A. The data flow diagram follows DFD guidelines. B. An arrow should never leave a bubble with no destination. C. Data should only flow from a data store. D. Data flow diagrams (DFDs) at this level should show the external entities.