The supply curve illustrates that firms:
A. decrease the supply of a good when its price rises.
B. increase the quantity supplied of a good when its price rises.
C. increase the supply of a good when its price rises.
D. decrease the quantity supplied of a good when input prices rise.
Answer: B
You might also like to view...
Refer to Figure 26-3. In the figure above, when the money supply shifts from MS1 to MS2, at the interest rate of 3 percent households and firms will
A) sell Treasury bills. B) neither buy nor sell Treasury bills. C) want to hold more money. D) buy Treasury bills.
The Great Depression consisted of how many business cycles?
A) 1 B) 2 C) 3 D) 4
The federal funds rate is
a. determined in a market but targeted by the Fed. b. chosen by the Fed and enforced on the banks. c. chosen by Congress and enforced on the Fed. d. chosen by Congress and enforced on the banks. e. determined in the market and beyond the control of the Fed.
Refer to the information provided in Figure 18.1 below to answer the question(s) that follow.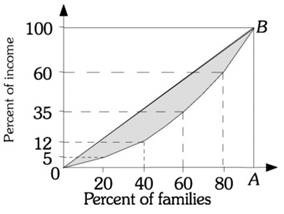 Figure 18.1Refer to Figure 18.1. Suppose that the Lorenz curve were the same as the 45-degree line OB. This would mean that
A. the distribution of income is perfectly equitable. B. only one family earned all the income. C. the distribution of income is equal. D. the distribution of income is completely inequitable.