Refer to the figure below.________ inflation will eventually move the economy pictured in the diagram from short-run equilibrium at point ________ to long-run equilibrium at point ________, 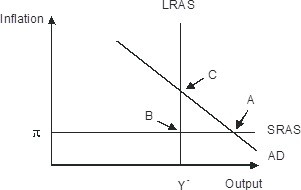
A. Rising; B; C
B. Falling; A; C
C. Falling; A; B
D. Rising; A; C
Answer: D
You might also like to view...
Why was OPEC unable to maintain high oil prices in the long run?
a. Demand and supply are both elastic in the long run compared to the short run. b. Demand and supply are both inelastic in the long run compared to the short run. c. Demand is elastic and supply is inelastic in the long run compared to the short run. d. Demand is inelastic and supply is elastic in the long run compared to the short run.
The quantity demanded of money falls as the
A) interest rate falls. B) interest rate rises. C) supply of money rises. D) none of the above, since the quantity demanded of money is unrelated to the interest rate
The shape of the production possibilities curve in the figure above indicates that
A) production of corn is characterized by increasing costs while the production of cloth is characterized by decreasing costs. B) production of both corn and cloth is characterized by increasing costs. C) production of both corn and cloth is characterized by constant costs. D) production of corn is characterized by constant costs and the production of cloth is characterized by increasing costs.
If an increase in income results in a decrease in the quantity demanded for a product, the product is ________, and the value of the income elasticity of demand is ________.
A. a normal good; positive B. a normal good, negative C. an inferior good; positive D. an inferior good; negative