Graph the function f(x) over the given interval. Partition the interval into 4 subintervals of equal length. Then add to your sketch the rectangles associated with the Riemann sum  , using the indicated point in the kth subinterval for ck.f(x) = 2x + 4, [0, 2], left-hand endpoint
A. 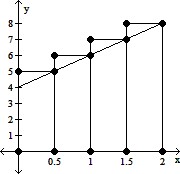
B. 
C. 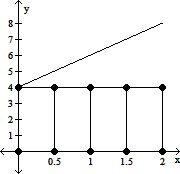
D. 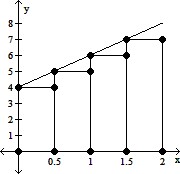
Answer: D
Mathematics
You might also like to view...
Solve the problem.Maximize  subject to
  ,
,  and
and 
A. 1 B. 17 C. e D. 0
Mathematics
Find the exact value of the expression.tan 345°
A. 
B. 2 + 
C. -2 - 
D. 
Mathematics
Find the volume of the indicated region.The region bounded by the cylinders 
 and the planes

A. 308? B. 77? C. 231? D. 154?
Mathematics
Determine any local or absolute extrema as indicated.Use the graph of f to estimate the local extrema.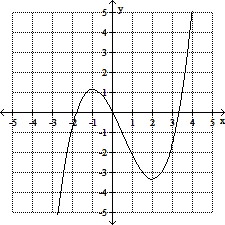
A. No local maximum; no local minimum B. Local maximum: -1; local minimum: 2 C. Local maximum: ?; local minimum: -? D. Local maximum: approx. 1.17; local minimum: approx. -3.33
Mathematics