We can use the graph in Figure 22.1 to read data from the chart. Use the rating curve to determine the gage height associated with the following discharges.
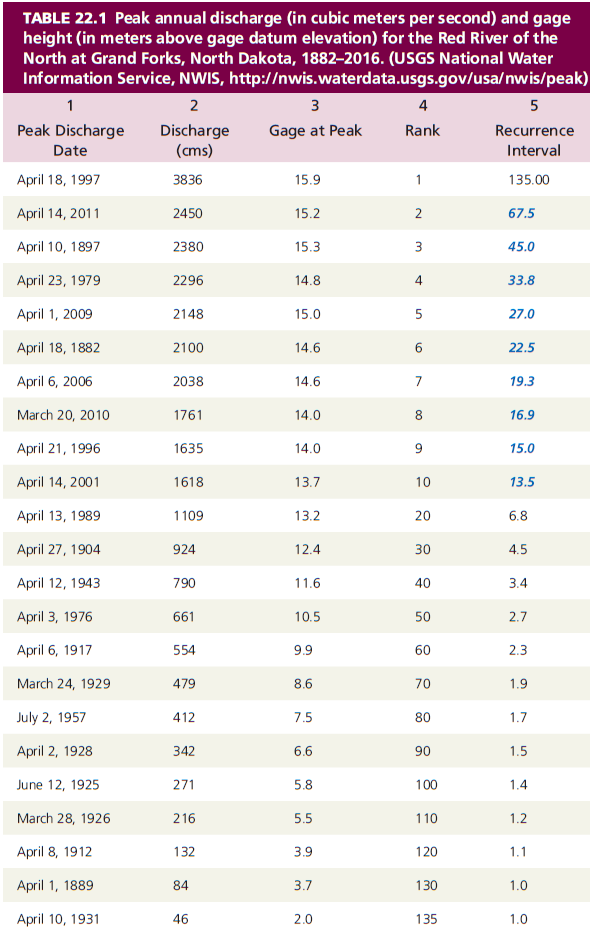
In general, there is a direct relationship between discharge and width, depth (gage height), and velocity. A stream’s rating curve relates stream discharge to the gage height. Figure 22.1 shows the gage height plotted against discharge. Note that the discharge axis is logarithmic.
100 cms: ________________
500 cms: ________________
1000 cms: ________________
3000 cms: ________________
100 cms: 3.0 m
500 cms: 9.0 m
1000 cms: 11.7 m
3000 cms: 17.0 m
You might also like to view...
At which of the following times does a mountain breeze develop its maximum strength?
A. about an hour after sunset B. just before sunrise C. about midnight D. early afternoon
Which area is most likely to contain brackish water?
a. sandy beach b. estuary c. deep ocean d. surface open ocean e. coral reef
Which is not a dominate delta type?
A) River-dominant B) Tide-dominant C) Current-dominant D) Wave-dominant
In humid regions of low relief, the water table may be so high it intersects the ground surface
Indicate whether the statement is true or false