Graph the function.y =  - 3
- 3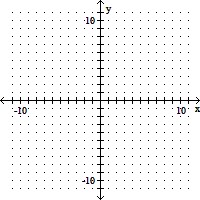
A. 
B. 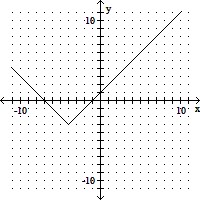
C. 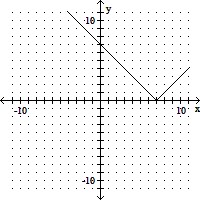
D. 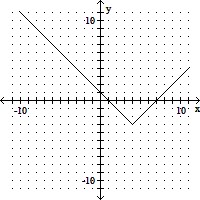
Answer: D
Mathematics
You might also like to view...
Graph the function.f(x) = 
A. 
B. 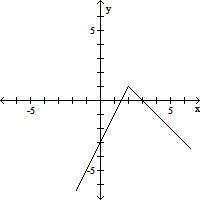
C. 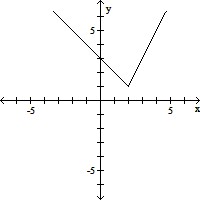
D. 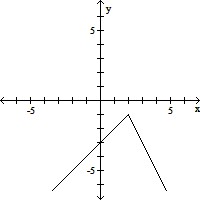
Mathematics
The bar graph below shows the recorded high temperatures in Little City for the indicated months. 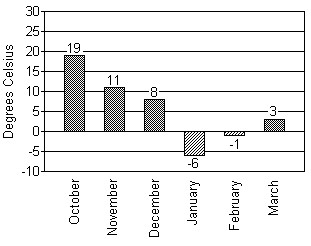 In which month was the recorded temperature closest to 0°C?
A. February B. January C. October D. March
Mathematics
Perform the division.
?
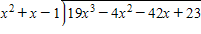
What will be an ideal response?
Mathematics
Solve the equation. -
-  = 0
= 0
A. -8, 0, 8 B. -8, 8 C. 8 D. No solution
Mathematics